This report is optional. Availability is based on your data collection requirements. Contact The Raymond Corporation through the iWAREHOUSE GATEWAY Contact Us link to request access to this report.
This chart report shows how much an asset is used per hour compared to the cost of that asset.
To access this report, click [Maintenance] Maintenance > [Assets] Assets > [Reports] Reports > [Recommendations] Recommendations. Make your filter selections, then click [Update Report] Update Report to display the new data.
Each asset is represented by a point on the chart.
Follow the steps to adjust the Set Cost Amount, the target Cost per Hour (CPH), and the target Utilization Hours for the selected asset types.
The current CPH dollar amount and Utilization Hour setting, respectively, are in parenthesis to the right of each asset type. Each number is a link. Select the number to change the settings on the chart, or to reset the amounts to the system defaults.
Follow the steps below:
1.From the Assets filter drop-down list, select the check box next to one or more asset types.
2.Change or reset the filter settings.
3.Click [Update Report] Update Report from the Filter pane.
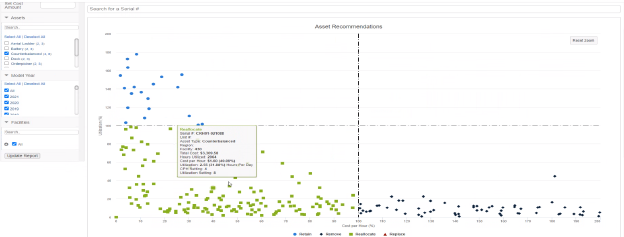
Each asset point is then redistributed into the appropriate quadrant on the chart (retained, removed, reallocated, or replaced.) based on the filters selected in the Filter pane.
4.Hover the cursor over an asset point on the chart to review how much that asset is used per hour compared to the cost of that asset.
5.Click the category label below the chart (Retain, Remove, Reallocate, or Replace) to display or hide that asset category.
The Total Cost, Number of Assets, and Cost per Asset information at the top of the report is based on the asset information shown in the chart. This information updates as a serial number is entered in the Search for a Serial # box.
A cost amount can be entered into the Filter pane to adjust the spending threshold of the report. When a cost amount is entered, the x-axis on the chart changes from the default percentage (%) to a cost amount. This can help detect assets whose total costs of operation exceed the specified amount.
This report contains the same information as the Asset Status Report, except that the Asset Status report is formatted as a list report. To access the Asset Status report, click the [View as List] View as List link above the report. To return to the Asset Reports Recommendations report, click the [View as Chart] View as Chart link above the Asset Status report.
To view asset lifetime costs, click a point on the chart or a serial number from the Serial # column below the chart, to open the Asset Snapshot Drill Down report.
Examples appear below:
Suggested Uses
•To determine whether each asset should be retained, removed, reallocated, or replaced.
•Use the “Search for a Serial #” area above the chart to quickly filter for a specific serial number.
•To determine which assets are least cost effective for the company.
•To indicate which assets cost more to maintain than they cost to buy.
•To indicate where an asset type appears on the chart according to its Cost per Hour (CPH).
Drill Down Reports
Related Links

